Skip to end of metadata
Go to start of metadata
You are viewing an old version of this page. View the current version.
Compare with Current
View Page History
Version 1
Current »
Observations
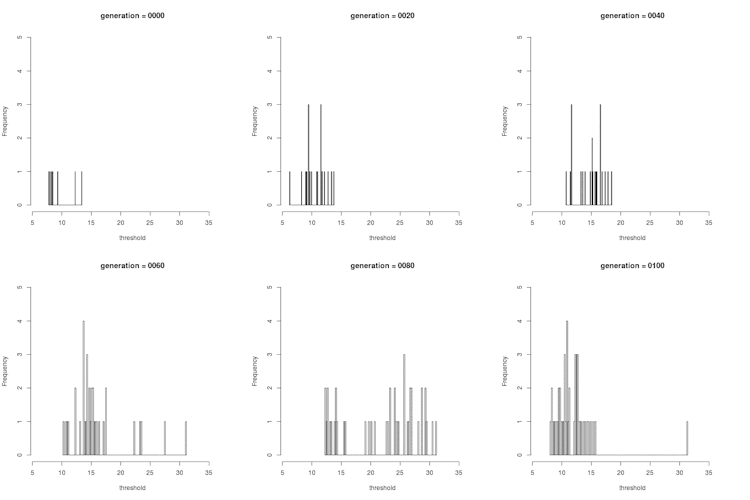
- Very high PC spending thresholds are no longer favoured.
Evidence
- Tables and image below show the distribution of validator thresholds as over time. We see the mean and variance both go up then come back down

- thresholdDist_full.csv
- thresholdDist.csv
Conclusions, Speculations and Future Work
- It looks like ~10 is the optimal value of the threshold (because of the way the population wanders away and then comes back). This would not be a random amount, but in fact equal to the amount on the genesis block. Perhaps we should try changing the amount of PC on the genesis block to see if this pattern holds.
