[draft] Storage performance
Problem
| Problem Statement | RNode does not perform at the level that is expected (40k COMM/s) |
| Hypothesis | This may be caused by how RSpace uses LMDB transactions. |
| Background | |
| Measures of Success | 1) Implement a fine grained locking scheme 2) Analyse and compare 3) Come up with a path forward |
Scope
| Activity | |
| Must have |
|
| Nice to have |
|
| Not in scope |
Milestones and deadlines
| Milestone | Owner | Status | Notes |
|---|---|---|---|
| Proof of concept implementation | Dominik Zajkowski | done | |
| Double locking scheme implemented | done | ||
| Measurements of double locking scheme | done | ||
| Further steps | ongoing | ||
| Analysis of serialisation impact. | Łukasz Gołębiewski (Unlicensed) | CORE-1281 - Getting issue details... STATUS | |
| Analysis of impact of storing continuation patterns separately. | Dominik Zajkowski | CORE-1301 - Getting issue details... STATUS |
Reference materials
Proof of concept implementation
As an attempt to show that there is value to be gained in implementing access to disjoint channels a version of RSpace was created that did no locking.
It is available at https://github.com/dzajkowski/rchain/tree/rspace/CORE-1134/MVarRSpace.
The only contract that was measurable in this implementation was the dupe contract. It showed that the underlying code is able of producing ~10k COMM/s:
Measurements of double locking scheme
After providing an implementation of the double lock mechanism we started to profile the code and measure performance.
ATM the findings are as follows:
- it's hard to setup a test that produces a lot of COMM events at once
- the double locking implementation does not spend 50% of execution time in lmdb write locks (!!current value needed!!)
- rspace is able to achieve higher COMM/s values
- on a 20k wide contract a ~30s gain was achieved (~ 2:30 → 2:00)
Currently the double locking mechanism is the default implementation of locking in RSpace but it can be switched with a config flag (--store-type lmdb).
Analysis:
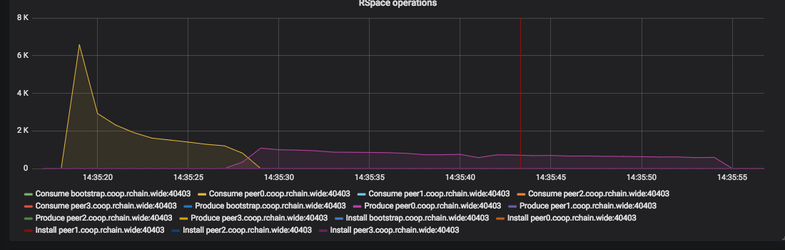
Relevant measured COMM/s for lmdb locking:
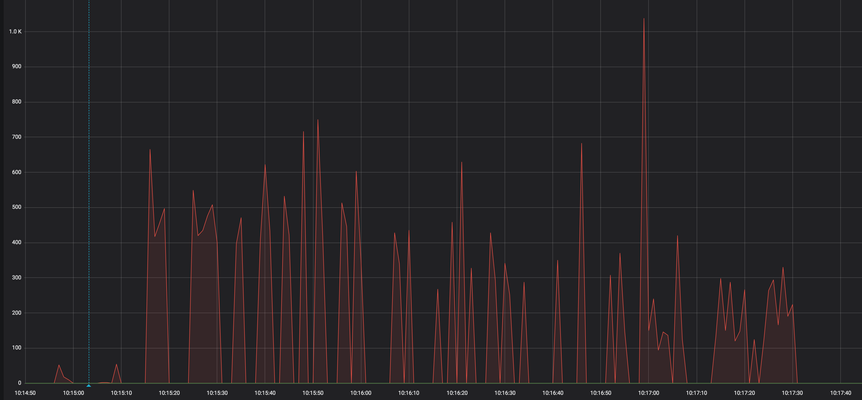
The initial fetch of the contract (wide) and dispatch take about 15 seconds. The bulk of the work starts at 10:15:15 and finishes at 10:17:30 (2:15s)
Peak is at 1036 COMM/s; average 148 COMM/s.
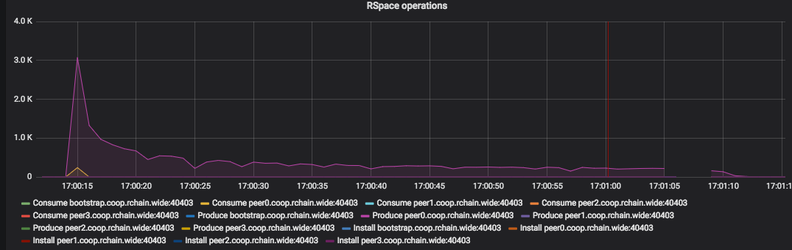
And double locking scheme:
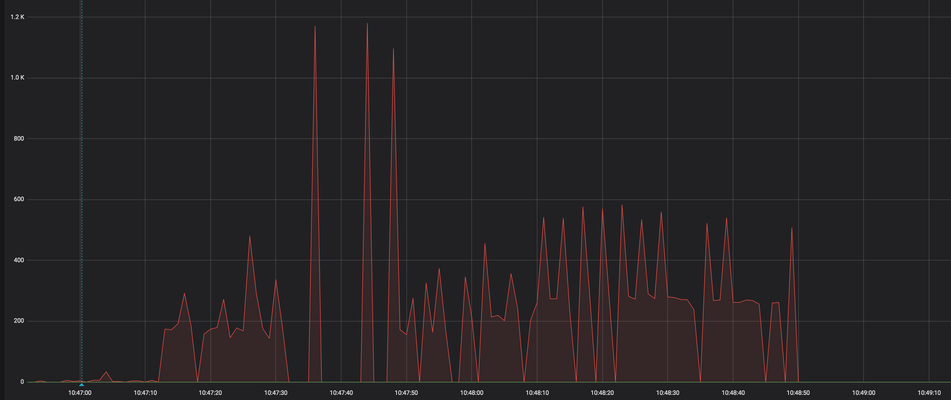
Initial fetch takes about 18 seconds. The bulk of the work starts at 10:47:12 and finishes at 10:48:50 (1:38s)
Peak is 1180 COMM/s; average 204 COMM/s.
After looking at the execution traces it's not obvious what is taking up the bulk of time.
Steps forward:
Investigate execution traces further.
Analysis of impact of storing continuation patterns separately. CORE-1301 - Getting issue details... STATUS
A discussion spawned regarding storing data:
- currently all the data is stored as a single blob (GNAT)
- produce is observably slower then consume in jmh based benchmarks
Steps TBD:
- reproduce and document the findings
- write a version that separates continuation patterns
- provide results for the modified version and compare to current one
Current state
[info] SimpleActionsBench.singleConsume    ss   10   5.281 ± 0.852  ms/op
[info] SimpleActionsBench.singleProduce    ss   10  16.282 ± 2.522  ms/op
Investigation findings
In it's current state RSpace produce and consume contains at least one low level action (getData, getWaitingContinuation, putJoin, putData etc).
A general flow consists of (at least one) LMDB DBi fetch, deserialisation, some business logic and then a serialisation of a modified GNAT and store.
By far the most time consuming action is serialisation and deserialisation. This topic is tracked in CORE-1281.
The point of CORE-1301 and CORE-1054 is the data organisation and degradation that can be observed with larger data sets.
ATM the data organisation in RSpace is as follows:
  final case class GNAT[C, P, A, K](
      channels: Seq[C],
      data: Seq[Datum[A]],
      wks: Seq[WaitingContinuation[P, K]]
  )
and in LMDB a Dbi has the form: ChannelsHash → GNAT.
This results in storing a growing "blob" of data under any single key (ChannelsHash).
To understand this approach it's beneficial to see how well it behaves:
[info] Benchmark                         Mode  Cnt     Score     Error  Units
[info] LMDBOpsBench.largeBlobGet         avgt   10     0.419 ±   0.164  ms/op
[info] LMDBOpsBench.largeBlobPut         avgt   10    18.702 ±   0.501  ms/op
[info] LMDBOpsBench.largeBlobRoundtrip   avgt   10    19.230 ±   0.578  ms/op
[info] LMDBOpsBench.mediumBlobGet        avgt   10     4.255 ±   1.695  ms/op
[info] LMDBOpsBench.mediumBlobPut        avgt   10   193.527 ±   6.147  ms/op
[info] LMDBOpsBench.mediumBlobRoundtrip  avgt   10   201.368 ±   9.504  ms/op
[info] LMDBOpsBench.smallBlobGet         avgt   10    45.504 ±  19.032  ms/op
[info] LMDBOpsBench.smallBlobPut         avgt   10  1921.072 ± 113.552  ms/op
[info] LMDBOpsBench.smallBlobRoundtrip   avgt   10  1949.684 ± 146.097  ms/op
The above tests were run with these params:
- large is 100 x 10000KB entries
- medium is 1000 x 1000KB entries
- small is 10000 x 100KB entries
Additionally comparing 100 x [10MB, 1000KB, 100KB] shows that the amount of data does not really affect the performance.
In other words it's more efficient to store a large blob of data (100 x 1000KB) than it is to store many small ones (10k x 10KB).
There are two problems with this approach:
- it's very inefficient to modify an existing value
- assuming a singular 1MB blob that holds 100 GNATs, adding one to it will result in a fetch, deserialisation, append, serialisation and a store; the same for one blob per GNAT would require serialisation and a store
- it forces deserialisation of large amounts of data
CORE-1301 and CORE-1054 and analysis of produce and consume all suggest that dumping a lot of data at once under a singular key is not a priority. Instead very efficient reads and updates should be prioritised.
The current approach has an additional drawback:
- fetching a set of waiting continuations does not cache, this results in multiple fetches of the same data (eg. produce requires getWaitingContinuation (fetchGnat & map) and getData (fetchGnat & map))
Additional observations:
- it does not matter how big the data blob fetched/stored is, the time will be similar
- reads are significantly faster then writes
Proposals
Note: changes in data organisation will affect how the whole algorithm behaves.
Splitting 'GNAT'
As described above any ChannelHash accumulates data as a singular entry in LMDB. This takes advantage of the ability of LMDB to fetch large amounts of data fast but does not align with the need to deserialise (which is significantly slower then the read) or to write (writing is not affected by the amount of data written but it is slower then reads) on each change (be it new value or removal of value).
Having a separate entry per Datum and WaitingContinuation and some metadata would allow the algorithm to append new values and remove data without having to fetch all the data under a singular ChannelHash.
This makes parts of consume and produce more efficient. It affects the performance of extractProduceCandidate which depends on a list of patterns.
Initial testing of 'KeyRange' LMDB mechanism shows that it performs good enough for using it with a bulk fetch.
Extraction of 'Patterns'
It seems that having additional Patterns → GNAT-Id cache per ChannelHash with cheap serialisation will help with extractProduceCandidate.
Caching fetched 'GNAT'
Current implementation will fetch the same GNAT in the same transaction and deserialise it if the channel that is used for WaitingContinuation and Data is the same. Introducing a transaction wide cache for deserialised GNAT will limit the amount of roundtrips in these cases.
Steps forward
- Get LMDBOpsBench reviewed and merged https://github.com/rchain/rchain/pull/1685
- Investigate further with wide contract (WideBench + Kamon + zipkin).
- Implement a version with KeyRange and compare.
- Investigate further with dupe contract (create new bench)
- Describe in detail effects of proposals (with benches showing differences)
Results of WideBench + Kamon + zipkin investigation
After further investigation, the following was observed:
- fetch and store in the context of LMDB still collide and result in a lot of waiting for a free write lock
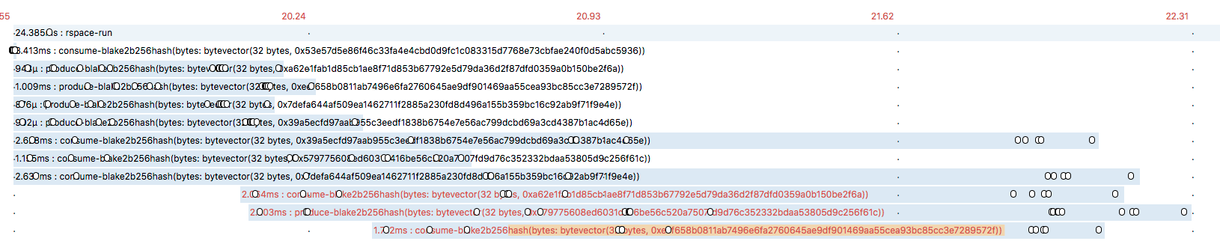
the above can be observed using zipkin (this is WideBench with 5 calls)

- the fact that a COMM cannot run 'at once' is obvious and can be observed with e.g. "0xd86358afdc6ec47ba7e08022fbfed5cc790f1464d4ef51c6de66ea37977ca457"
- the troubling observation is that each consecutive action (be it produce or consume) takes longer
- it all boils down to which action gets the lmdb lock first
- every other action is bogged down waiting
- it also shows that storing data takes time and the single writer still affects execution time
the trace file:
Following the above a lock free implementation of Store was provided.
The same test:
While the interesting piece of wide took 9ms with LMDB it took about 3ms with inmemory.
The encouraging part is the fact that actions take either about 1Unit of time or 2. So it looks that getting a lock in RSpace is fairly fair and the TrieMap allows for good enough simultaneous access.
It's more obvious with a larger contract (wide, 2000 contracts).
LMDB backed = 2.8s
InMemory backed = 340ms
This merited further investigation. A version for perf testing was deployed to stress-docker.
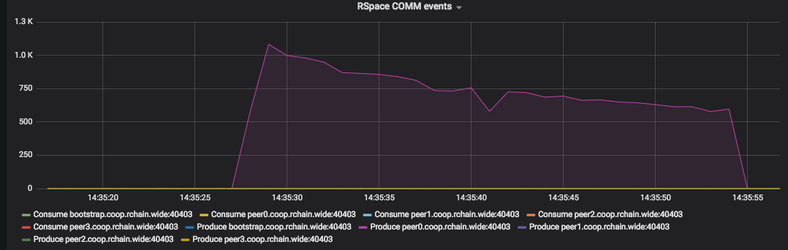
The above is a run of wide with 20k contracts (same as the double lock lmdb backed on the beginning of this page). This suggests that the run took ~28s.
This view is included because it is the same interpretation of "done" that was used up until now.
But additional data should be considered:
This view shows that in fact the run took 37s if all the computations are taken into account. What seems noteworthy is that it looks like the discovered actions that need to be computed are ordered by type (sends first, produces next).
A small change was made to rholang reducer which shuffled the incoming actions

The net effect is a slowdown (1m 10s) but a burst of COMM events suggests that it might make sense to pursue this further.
Steps forward
- open a discussion with rholang team about shape of incoming data
- get lock free store implementation part of dev
- investigate the slowdown observed in last experiment
- Implement a version with KeyRange and compare.
- Investigate further with dupe contract (create new bench)
Analysis of RSpace behaviour with 'wide' contract.
Replace event log syncvar with a concurrent structure. CORE-1386 - Getting issue details... STATUS
AtomicAny was used to store the event log.
The comparison shows that the change is insignificant.
Proposed ways forward:
- the event log does not need to be gathered inside rspace lock, some much needed refactor could result in the matcher returning refs to events
Figure out SpatialMatcher impact on rspace. CORE-1404 - Getting issue details... STATUS CORE-1399 - Getting issue details... STATUS
- while running comparisons of wide the following observations were made
- usually a run of produce (while the tuplespace holds consumes) takes about 0.9ms
- a simple match (one consume in the tuplespace) takes about 0.35ms
- this merits a further dig into optimisation of the macher
Analysis of serialization impact. CORE-1281 - Getting issue details... STATUS
The benchmark in https://github.com/rchain/rchain/pull/1700#issuecomment-431115789 clearly shows, that kryo is faster only in case of the internal rspace model (GNAT). The Rholang model classes are serialized faster with protobuf. In order to gain performance we should consider removing scodec and serialize the rspace model using protobuf